Welcome

… to the personal website and blog of Hansjörg Plieninger.

Tutorial on tidymodels for Machine Learning

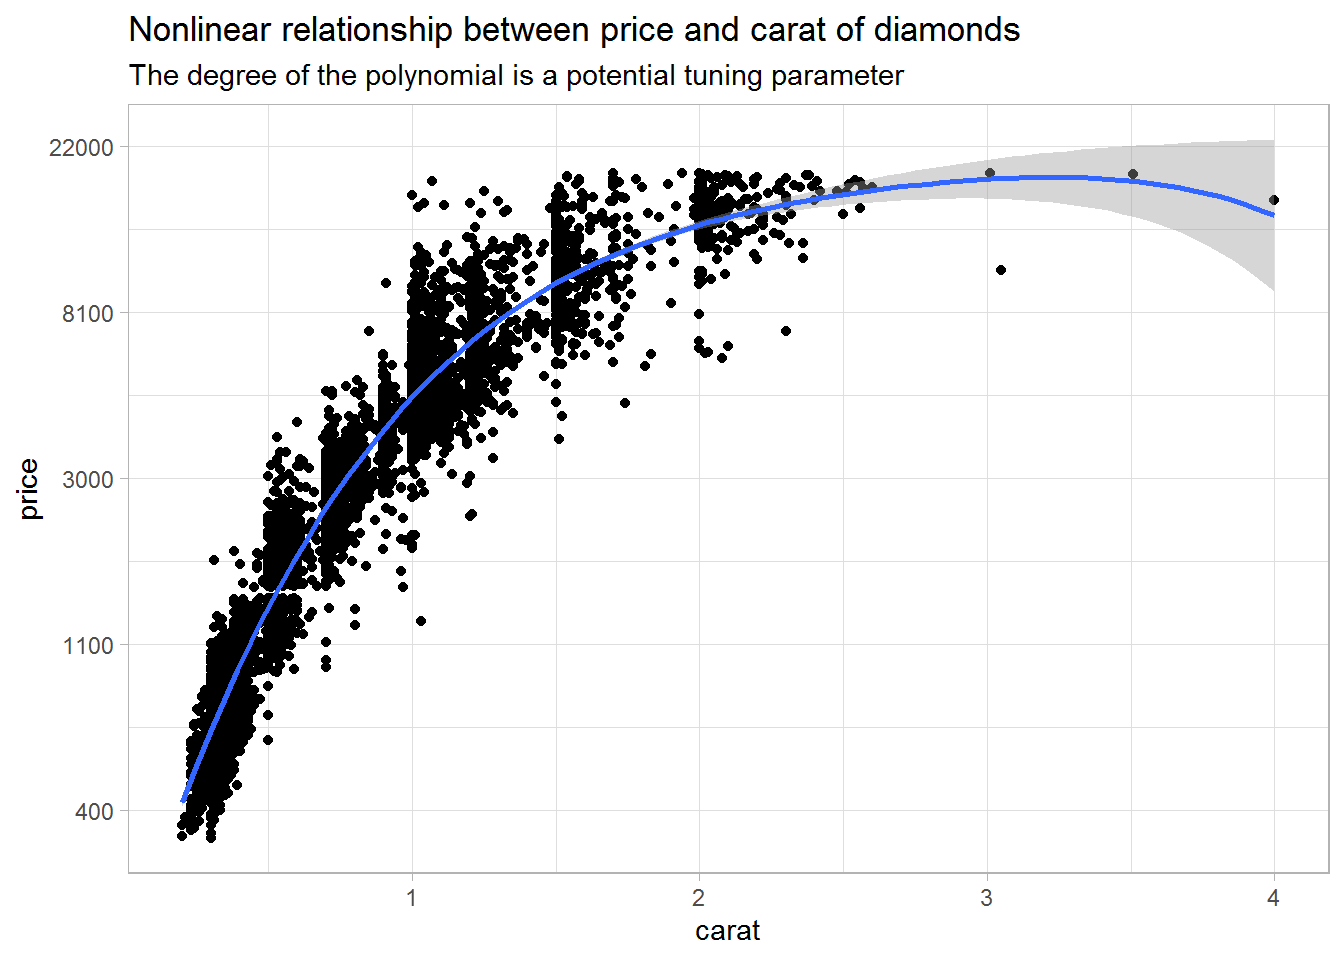
This tutorial introduces R users to the tidymodels ecosystem. Similar to the tidyverse, tidymodels is a meta package that bundles together modular packages that work hand in hand to make the live of data scientists easier. Herein, the recipes package is used for data pre-processing, parsnip for model fitting, tune for hyperparameter tuning, and much more. For illustration, a random forest model is fit to the diamonds data set. [Read More]

Regression Modeling With Proportion Data (Part 2)

Attendance in Handball-Bundesliga Rose By 7 % After World Championship

In the first part of this post, I demonstrated how beta and quasi-binomial regression can be used with dependent variables that are proportions or ratios such as the attendance rates of the German Handball-Bundesliga. In the second part, I want to investigate whether attendance increased after the World Championship that took place in January 2019 in Denmark and Germany. [Read More]

Regression Modeling With Proportion Data (Part 1)

Predicting Attendance in the German Handball-Bundesliga

As a data scientist, one often encounters dependent variables that are proportions, for example, the attendance rate of public events. Modeling and predicting such variables in a regression framework is possible, but one has to go beyond the standard linear model. In this blog post, I will compare different models that are available for proportions and illustrate them to predict the attendance rate of matches of the German Handball-Bundesliga. [Read More]

Durchschnittsalter in den Mannheimer Stadtteilen

Geodaten plotten mit ggplot2

Ich wollte schon immer einmal Geodaten plotten und heute bin ich endlich dazu gekommen das auszuprobieren. Das Plotten selbst ist eigentlich ganz einfach. Die Herausforderung besteht eher darin die Daten aufzubereiten, in diesem Fall die Polygone der Stadtteile von Mannheim. In den Daten sieht man sehr schön wie unterschiedlich das Durchschnittsalter in den Mannheimer Stadtteilen ist bei gleichzeitig hoher zeitlicher Stabilität. [Read More]

Plotting Many Groups With ggplot2

The shape palette can deal with a maximum of 6 discrete values because more than 6 becomes difficult to discriminate

ggplot2 is a great R package and I use it almost everyday. When plotting data for different groups, one has different options to identify them, for example, by means of different colors or different shapes. However, with many groups, it often becomes very difficult or even impossible to discriminate between the groups. Herein, I will illustrate a solution to plot an intermediate number of groups with ggplot2. First, I will use different colors to discriminate between the groups. [Read More]
ggplot 

Run Mplus from Notepad++

I use Mplus for multilevel models or structural equation modeling from time to time. However, I prefer to edit the input file in Notepad++ because it has richer options to edit text files such as column mode editing. But instead of edit -> save -> close in Notepad++ and then open -> run in Mplus, there should be an easier solution. I always knew that this option existed, but today I put that feeling into practice. [Read More]
mplus 

Lowest Number of Red Cards in 40 Years

Web Scraping FIFA World Cup Data

While watching a FIFA World Cup game, I suddenly had the impression that games got fairer over the years. Everybody remembers the headbutt of Zinedine Zidane, but I haven’t seen similar things in 2018. I always wanted to try out web scraping and this was the opportunity to do so. https://media.giphy.com/media/9AuHkzLy26AmI/giphy.gif In this post, I will give a very brief intro to web scraping focusing mostly on scraping the World Cup data. [Read More]

Categorical Predictors in ANOVA and Regression

Data with categorical predictors can be analyzed in a regression framework as well as in an ANOVA framework. In either case, the grouping variable needs to be recoded and a default coding system for categorical variables is often dummy coding. Even though I usually prefer the more general regression framework, I like the ANOVA perspective because of its focus on meaningful coding schemes beyond dummy coding. Herein, I will illustrate how to use any coding scheme in either framework which will help you (a) to switch between ANOVA and regression and (b) use sensible comparisons of your groups. [Read More]

Tutorial: Rasch and 2PL Model in R

Recently, I wrote a summary of some illustrative IRT analyses for my students. Quickly, I realized that this might be of interest to others as well, and I am posting here a tutorial for the Rasch model and the 2PL model in R. It is meant for people with a basic understanding of these models who have heard terms like ICC or item difficulty before and who would like to see a practical, worked example. Possibly, the code may be copied and applied to your own data. [Read More]

Accepted Paper: A New Model for Acquiescence

Today, our paper “A new model for acquiescence at the interface of psychometrics and cognitive psychology” has been accepted at Multivariate Behavioral Research. Therein, I developed together with Daniel Heck a model for acquiescence response style on the basis of item response theory, more specifically IR-tree models, and multinomial processing tree models. This research took a long time but was also great fun, especially the collaboration with Daniel. You will soon find the final paper under publications and at MBR, and the abstract is posted below. [Read More]